Interactive Data Exploration and Analytics (IDEA)
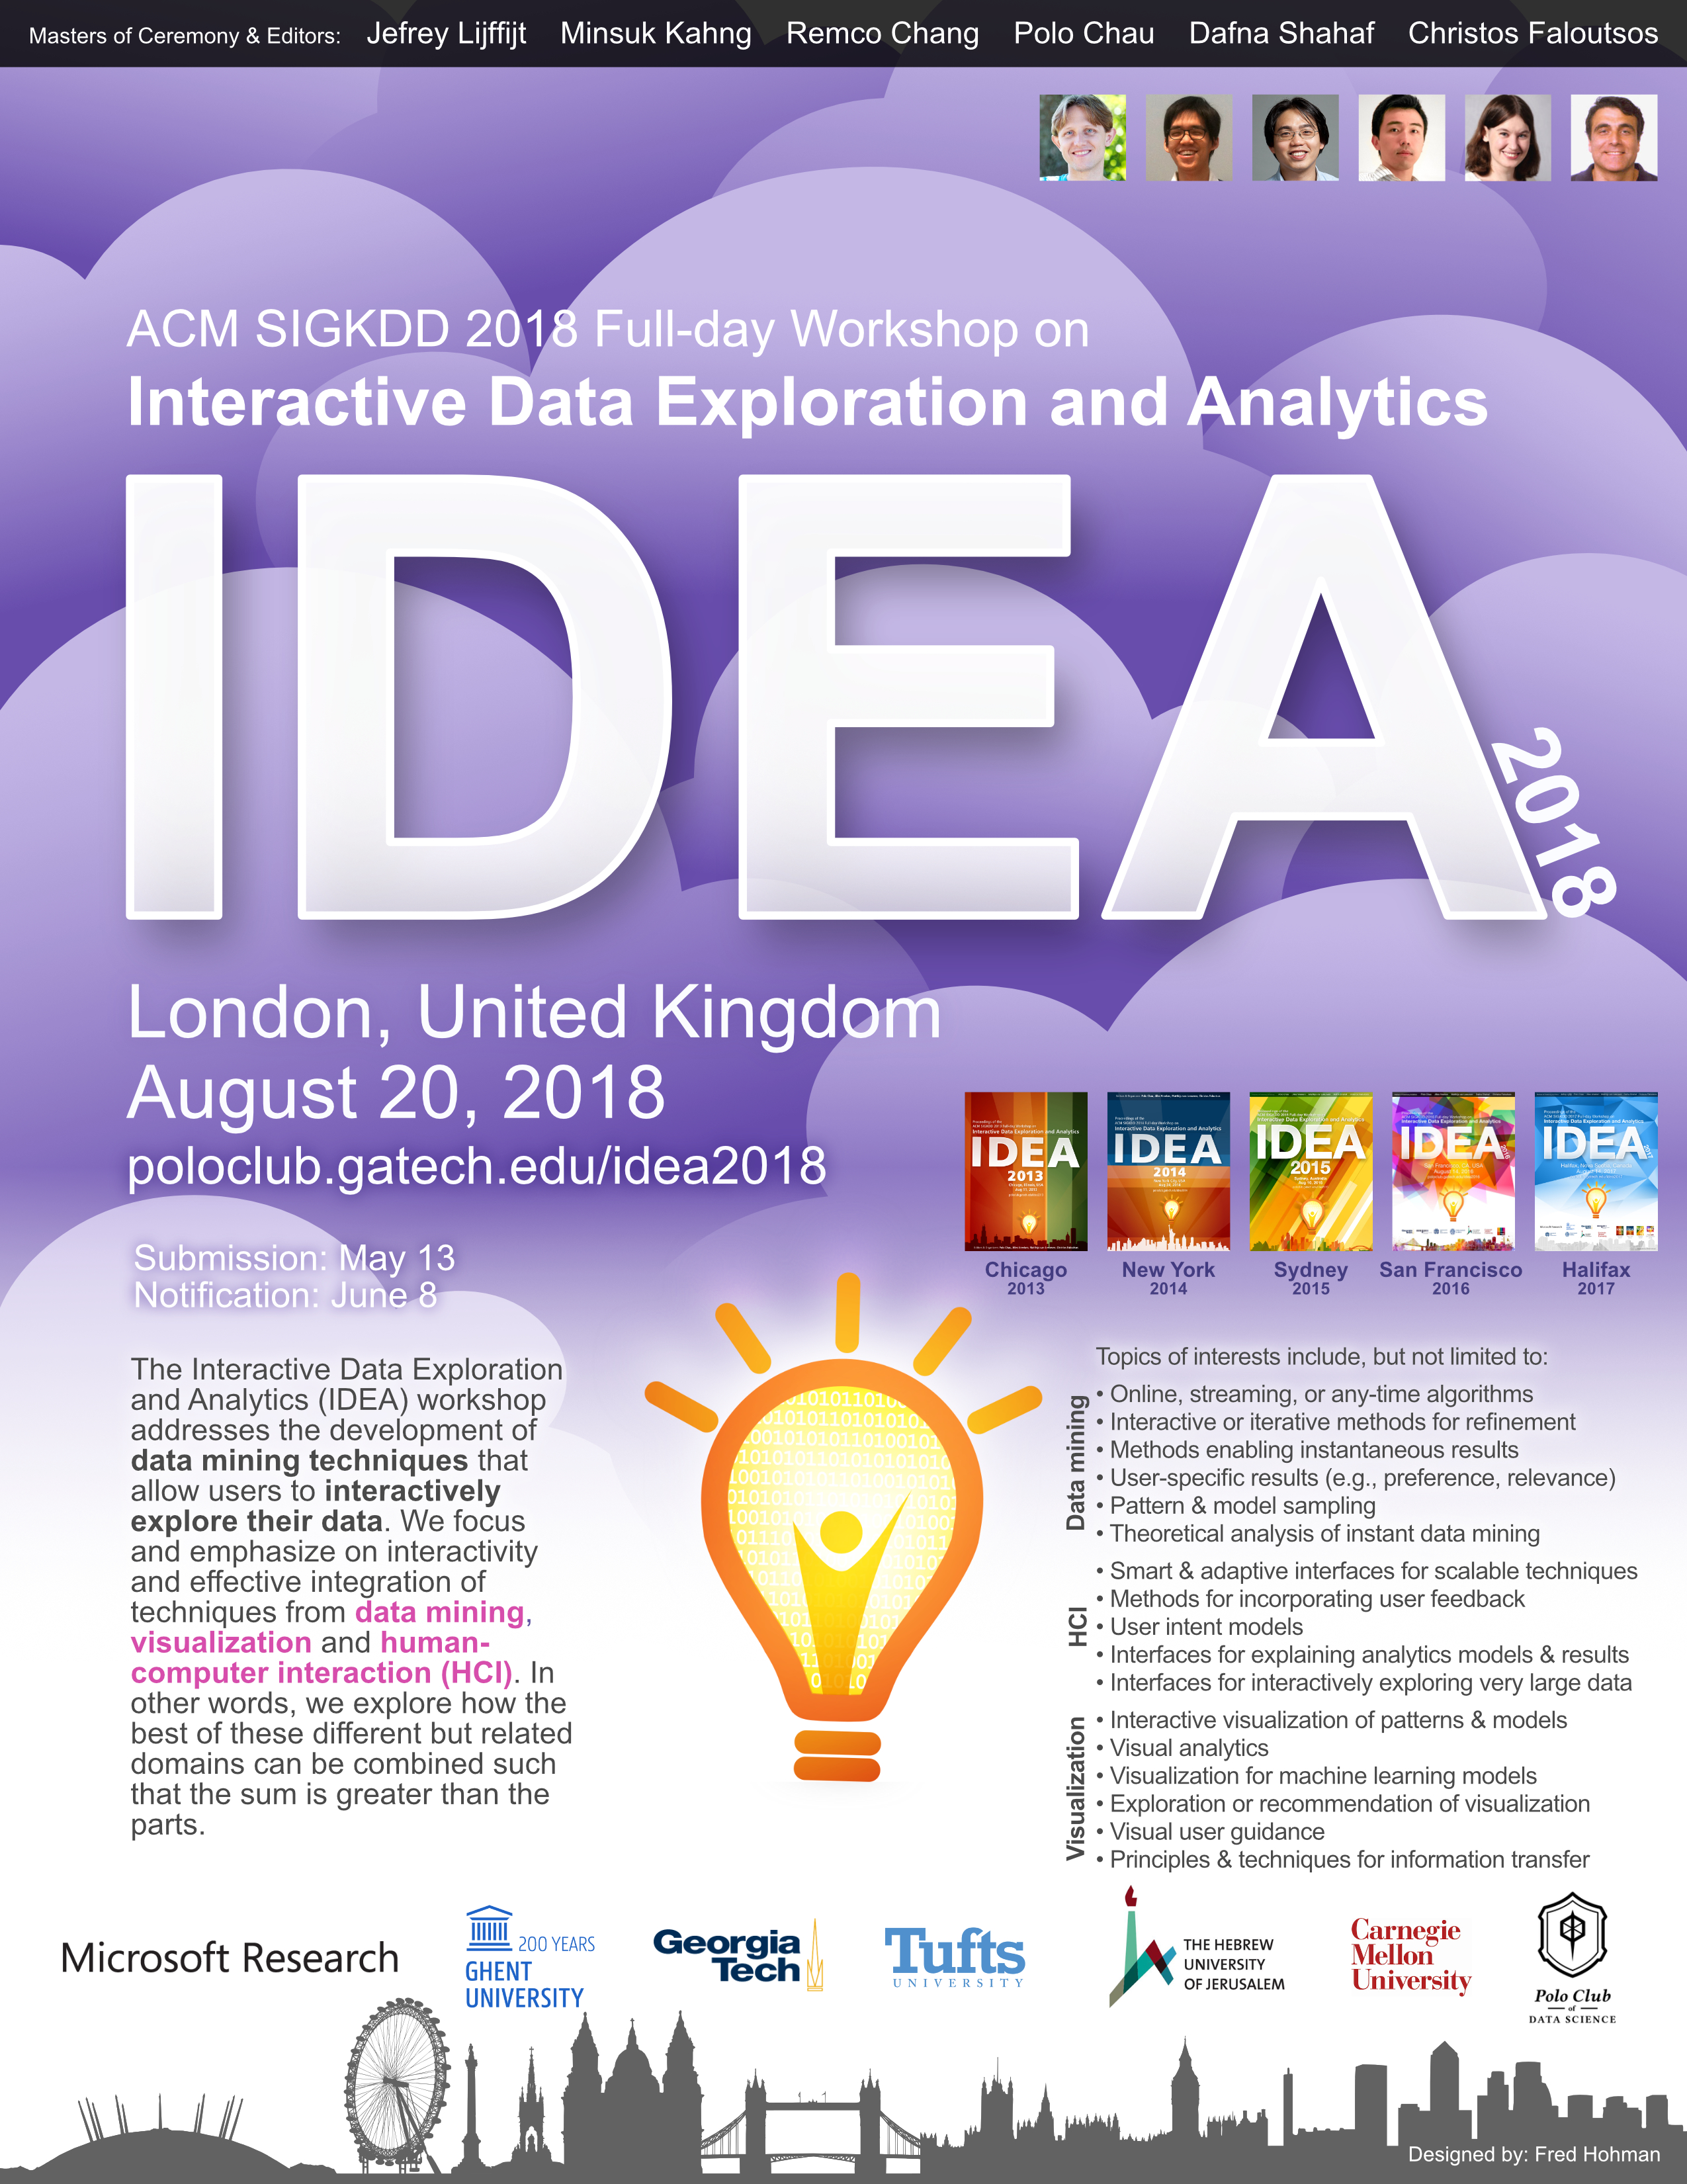
The Interactive Data Exploration and Analytics (IDEA) workshop addresses the development of data mining techniques that allow users to interactively explore their data. We focus and emphasize on interactivity and effective integration of techniques from data mining, visualization and human-computer interaction (HCI). In other words, we explore how the best of these different but related domains can be combined such that the sum is greater than the parts. The IDEAs at KDD in Chicago 2013, in New York City 2014, in Sydney 2015, in San Francisco 2016, and in Halifax 2017 were all a great success.
Program & Attending IDEA
IDEA will be a full-day workshop on Monday, Aug 20, at KDD 2018 in the ICC London Suite Room 2+3 (Level 0) at ExCeL London. You may register and book hotel rooms through KDD.In total, 13 papers have been accepted for presentation, 6 for oral presentation over the day, all 13 for interactive discussion at the poster + demo + networking session.
| 8:15 | Welcome to IDEA'18 |
| 8:30 |
Keynote 1 Prof. Min Chen
Oxford University Building a Theoretical Foundation for Visual Analytics
Min Chen developed his academic career in Wales between 1984 and 2011. He is currently the professor of scientific visualization at Oxford University and a fellow of Pembroke College. His research interests include visualization, computer graphics and human-computer interaction. He has co-authored some 200 publications, including his recent contributions in areas such as theory of visualization, video visualization, visual analytics, and perception and cognition in visualization. He has worked on a broad spectrum of interdisciplinary research topics, ranging from the sciences to sports, and from digital humanities to cybersecurity. His services to the research community include papers co-chair of IEEE Visualization 2007 and 2008, Eurographics 2011, IEEE VAST 2014 and 2015; co-chair of Volume Graphics 1999 and 2006, EuroVis 2014; associate editor-in-chief of IEEE Transactions on Visualization and Computer Graphics; and co-director of Wales Research Institute of Visual Computing. He is currently an editor-in-chief of Computer Graphics Forum. He is a fellow of British Computer Society, European Computer Graphics Association, and Learned Society of Wales.
Abstract
In this talk, the speaker will first provide an overview of the theoretical discourses in the field of visualization and visual analytics, discussing the aspects of the Theoretical Foundation of Visual Analytics, including taxonomies and ontologies, principles and guidelines, conceptual models and theoretic frameworks, and quantitative laws and theoretic systems. The speaker will then make an argument that information theory can potentially bring the four main components of visual analytics (i.e., statistics, algorithms, visualization, and interaction) together under the same theoretic framework. |
| 9:30 | Coffee |
| 10:00 |
Keynote 2 Prof. Tijl De Bie
Ghent University An information-theoretic framework for data exploration: From itemsets to embeddings, from interestingness to privacy
Tijl De Bie is currently Full Professor at the University of Ghent. Before moving to Ghent, he was a Reader at the University of Bristol, where he was appointed Lecturer (Assistant Professor) in January 2007. Before that, he was a postdoctoral researcher at the KU Leuven (Belgium) and the University of Southampton. He completed his PhD on machine learning and advanced optimization techniques in 2005 at the KU Leuven. During his PhD he also spent a combined total of about 1 year as a visiting research scholar in U.C. Berkeley and U.C. Davis.
He is currently most actively interested in the formalization of subjective interestingness in exploratory data mining, and in the use of machine learning and data mining for music informatics as well as for web and social media mining. He currently holds a grant portfolio of around EUR 4M, including a prestigious ERC Consolidator Grant titled "Formalizing Subjective Interestingness in Exploratory Data Mining" (FORSIED), as well as an FWO Odysseus grant titled "Exploring Data: Theoretical Foundations and Applications to Web, multimedia, and Omics Data".
Abstract
Appropriately quantifying the interestingness (aka 'quality') of patterns (aka 'relations', 'aspects', 'views', 'data mining results'...) extracted from data is the crux of many data exploration tasks. For example, the interestingness of frequent itemsets in a binary data matrix, of dense communities in a network, of associations in relational a database, and of low-dimensional embeddings of a high-dimensional data set, all have been quantified in numerous ways, reflecting the intrinsic difficulty and ambiguity of this challenge. In this talk I will present an overview of the main results of my ongoing ERC project FORSIED ("Formalizing Subjective Interestingness in Exploratory Data Mining"), which aims to address this challenge by developing an information-theoretic unifying perspective on it. I will end by discussing some extensions of these results towards privacy-preserving data mining, fairness, and beyond. |
| 11:00 |
Research Talks
|
| 12:00 | Lunch |
| 12:55 | Re-welcome |
| 1:00 |
Research Talks
|
| 1:30 |
Keynote 3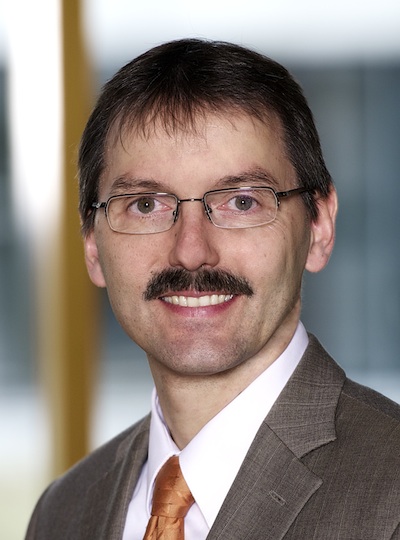 Prof. Daniel Keim
University of Konstanz Solving Problems with Visual Analytics: The Role of Visualization and Analytics in Exploring Big Data
Daniel Keim is professor and head of the Information Visualization and Data Analysis Research Group at the Computer Science Department of the University of Konstanz, Germany. He has been actively involved in data analysis and information visualization research for more than 30 years and developed a number of novel visual analysis techniques for very large data sets. He has been program co-chair of the IEEE InfoVis and IEEE VAST as well as the ACM SIGKDD conference, and he is chair of the IEEE VAST steering committee. He has been coordinator of the German Science Foundation funded Strategic Research Initiative “Scalable Visual Analytics” and scientific coordinator of the European Commission funded Coordination Action “Visual Analytics – Mastering the Information Age (VisMaster)”. Dr. Keim got his Ph.D. and habilitation degrees in computer science from the University of Munich. Before joining the University of Konstanz, Dr. Keim was associate professor at the University of Halle, Germany and Senior Technology Consultant at AT&T Shannon Research Labs, NJ, USA.
Abstract
Never before in history data is generated and collected at such high volumes as it is today. As the volumes of data available to scientists increase, their effective use becomes more challenging. Keeping up to date with the flood of data, using standard tools for data analysis and exploration, is fraught with difficulty. Visual analytics seeks to provide people with better and more effective ways to understand and analyze large datasets, while also enabling them to immediately act upon their findings. Visual analytics integrates the analytic capabilities of the computer and the abilities of the human analyst, allowing novel discoveries and empowering individuals to take control of the analytical process. In the visual analysis process, it is not obvious what can be done by automated analysis and what should be done by interactive visual methods. In dealing with massive data, the use of automated methods is mandatory, but there is also a wide range of problems where the use of interactive visual methods is necessary. The talk discusses the different roles of visualization and analysis techniques and exemplifies them with several application examples, illustrating the exiting potential of current visual analysis techniques but also their limitations. |
| 2:30 | Closing words |
| 2:35 |
Posters + Interactive Demo + Networking Session + Coffee
13 posters total, including those for oral presentations
|
| 4:00 | The end |
What's the IDEA?
It has been premised by many that interactive data mining techniques that aptly integrate human intuition, visual pattern recognition, and background knowledge with the number crunching capabilities of modern computers—by means of visualization and feedback loops—could help researchers, businesses, journalists, and other data users gain insights unattainable otherwise. Yet, the development of methods and techniques that can function as building blocks for such interactive systems is still in its infancy.
The goal of the IDEA workshop is to encourage the development of methods and techniques to (1) more effectively and efficiently communicate results from analysis algorithms, e.g., visualization of patterns and models, (2) enable rich, efficient, and accurate user feedback to select and manipulate models or provide information about their relevance or interestingness, (3) provide data analysis at interactive speed. We aim to raise awareness of the need for data analysis algorithms that enable interactive use (take feedback into account), so the algorithms and the user work together to make discoveries in complex data. This hybrid approach—combining powerful techniques from data mining, visualization, and HCI—forms an new class of techniques that enable truly inter-active data analysis. The focus and emphasis is on interactivity and communication—information transfer to and from users, i.e., techniques at the interface of data mining, visualization, and HCI. In other words, we intend to explore how the best of these different but related domains can be combined such that the sum is greater than the parts.
Important Dates
| Submission | |
| Extended deadline | |
| Notification | |
| Camera-ready | |
| Workshop | Mon, August 20, 2018 |
Call for Papers
Topics of interests for the workshop include, but are not limited to:
- Data mining (DM)
- Online, streaming, or any-time algorithms
- Methods supporting interactive, iterative, or adaptive refinements
- Methods enabling instantaneous results
- User-specific results (preference, relevance, interestingness)
- Pattern & model sampling
- Theoretical/complexity analysis of instant data mining
- Human-computer interaction (HCI)
- Smart and adaptive interfaces for scalable techniques
- Methods, principles and mechanisms for incorporating user feedback
- User intent models
- Interfaces for explaining and interpreting analytics models and results
- Interfaces for interactively exploring and querying very large data
- Visualization (VIS)
- Interactive visualization of patterns and models
- Visual analytics
- Visualization for machine learning models
- Exploration or recommendation of visualization
- Visual user guidance
- Principles and techniques for information transfer
We invite any type of contribution on these topics: new principles, methods, systems, empirical evaluations, etc.
Submission Information
All papers will be peer reviewed, single-blinded. We welcome many kinds of papers, such as (and not limited to):
- Novel research papers
- Demo papers
- Work-in-progress papers
- Visionary papers (white papers)
- Appraisal papers of existing methods and tools (e.g., lessons learned)
- Relevant work that has been previously published
- Work that will be presented at the main conference of KDD
Authors should clearly indicate in their abstracts the kinds of submissions that the papers belong to, to help reviewers better understand their contributions. Submissions must be in PDF, written in English, no more than 10 pages long — shorter papers (including extended abstracts) are also welcome — and formatted according to the standard double-column ACM Sigconf Proceedings Style.
The accepted papers will be posted on the workshop website and will not appear in the KDD proceedings.
For accepted papers, at least one author must attend the workshop to present the work.
For paper submission, proceed to the IDEA 2018 submission website.
Keynotes
Prof. Min Chen
Oxford University
Building a Theoretical Foundation for Visual Analytics
In this talk, the speaker will first provide an overview of the theoretical discourses in the field of visualization and visual analytics, discussing the aspects of the Theoretical Foundation of Visual Analytics, including taxonomies and ontologies, principles and guidelines, conceptual models and theoretic frameworks, and quantitative laws and theoretic systems. The speaker will then make an argument that information theory can potentially bring the four main components of visual analytics (i.e., statistics, algorithms, visualization, and interaction) together under the same theoretic framework.
Prof. Tijl De Bie
Ghent University
An information-theoretic framework for data exploration: From itemsets to embeddings, from interestingness to privacy
He is currently most actively interested in the formalization of subjective interestingness in exploratory data mining, and in the use of machine learning and data mining for music informatics as well as for web and social media mining. He currently holds a grant portfolio of around EUR 4M, including a prestigious ERC Consolidator Grant titled "Formalizing Subjective Interestingness in Exploratory Data Mining" (FORSIED), as well as an FWO Odysseus grant titled "Exploring Data: Theoretical Foundations and Applications to Web, multimedia, and Omics Data".
Appropriately quantifying the interestingness (aka 'quality') of patterns (aka 'relations', 'aspects', 'views', 'data mining results'...) extracted from data is the crux of many data exploration tasks. For example, the interestingness of frequent itemsets in a binary data matrix, of dense communities in a network, of associations in relational a database, and of low-dimensional embeddings of a high-dimensional data set, all have been quantified in numerous ways, reflecting the intrinsic difficulty and ambiguity of this challenge. In this talk I will present an overview of the main results of my ongoing ERC project FORSIED ("Formalizing Subjective Interestingness in Exploratory Data Mining"), which aims to address this challenge by developing an information-theoretic unifying perspective on it. I will end by discussing some extensions of these results towards privacy-preserving data mining, fairness, and beyond.
Prof. Daniel Keim
University of Konstanz
Solving Problems with Visual Analytics: The Role of Visualization and Analytics in Exploring Big Data
Never before in history data is generated and collected at such high volumes as it is today. As the volumes of data available to scientists increase, their effective use becomes more challenging. Keeping up to date with the flood of data, using standard tools for data analysis and exploration, is fraught with difficulty. Visual analytics seeks to provide people with better and more effective ways to understand and analyze large datasets, while also enabling them to immediately act upon their findings. Visual analytics integrates the analytic capabilities of the computer and the abilities of the human analyst, allowing novel discoveries and empowering individuals to take control of the analytical process. In the visual analysis process, it is not obvious what can be done by automated analysis and what should be done by interactive visual methods. In dealing with massive data, the use of automated methods is mandatory, but there is also a wide range of problems where the use of interactive visual methods is necessary. The talk discusses the different roles of visualization and analysis techniques and exemplifies them with several application examples, illustrating the exiting potential of current visual analysis techniques but also their limitations.
IDEA 2017 Keynotes
 Dr. Rich Caruana
Microsoft Research
 Prof. Leman Akoglu
Carnegie Mellon University
 Prof. Samuel Kaski
Aalto University, HIIT
IDEA 2016 Keynotes
 Prof. Jerome H. Friedman
Stanford University
 Prof. Jeffrey Heer
University of Washington, Trifacta
 Prof. Eamonn Keogh
UC Riverside
 Dr. Saleema Amershi
Microsoft Research
IDEA 2015 Keynotes
 Prof. Geoff Webb
Monash University
 Prof. Jure Leskovec
Stanford University
IDEA 2014 Keynotes
 Prof. Ben Shneiderman
University of Maryland, College Park
 Prof. Aditya Parameswaran
University of Illinois (UIUC)
IDEA 2013 Keynotes
 Prof. Haesun Park
Georgia Tech
 Prof. Marti Hearst
UC Berkeley
Organizers
 Jefrey Lijffijt
Ghent University
 Minsuk Kahng
Georgia Tech
 Remco Chang
Tufts University
 Polo Chau
Georgia Tech
 Dafna Shahaf
The Hebrew University of Jerusalem
 Christos Faloutsos
Carnegie Mellon Contact us at:
idea.kdd (at) gmail.com
Sponsors, Supporters & Friends


Program Committee
Adam Perer (IBM Research, USA)
Ahmad Mel (Ghent U, Belgium)
Andreas Henelius (Aalto U, Finland)
Arjun Srinivasan (Georgia Tech, USA)
Arnab Nandi (Ohio State, USA)
Bart Goethals (U of Antwerp, Belgium)
Bo Kang (Ghent U, Belgium)
Danai Koutra (U of Michigan, USA)
Daniel Keim (U of Konstanz, Germany)
Di Jin (U of Michigan, USA)
Emilia Oikarinen (FIOH, Finland)
Esther Galbrun (INRIA Nancy, France)
Fred Hohman (Georgia Tech, USA)
Geoff Webb (Monash U, Australia)
George Forman (Amazon, USA)
Hanghang Tong (Arizona State, USA)
Hannah Kim (Georgia Tech, USA)
Jaegul Choo (Korea U, South Korea)
James Abello (Rutgers U, USA)
Jia-Yu (Tim) Pan (Google, USA)
Jilles Vreeken (MPI-INF, Germany)
Kai Puolamäki (Aalto U, Finland)
Kevin Roundy (Symantec, USA)
Kijung Shin (Carnegie Mellon U, USA)
Marco Cavallo (IBM Research, USA)
Mario Boley (MPI-INF, Germany)
Nan Cao (NYU Shanghai, China)
Robert Pienta (Symantec, USA)
Robin Vandaele (Ghent U, Belgium)
Saleema Amershi (Microsoft Research, USA)
Siegfried Nijssen (Catholic U of Louvain, Belgium)
Stefan Kramer (U of Mainz, Germany)
Steffen Koch (U of Stuttgart, Germany)
Stephan Günnemann (TU Munich, Germany)
Sucheta Soundarajam (Syracuse U, USA)
Thibault Sellam (Columbia U, USA)
Thomas Gärtner(U of Nottingham, UK)
Thomas Seidl (LMU Munich, Germany)
Tijl De Bie (Ghent U, Belgium)
Xu Chu (Georgia Tech, USA)
Zhiyuan (Jerry) Lin (Stanford U, USA)